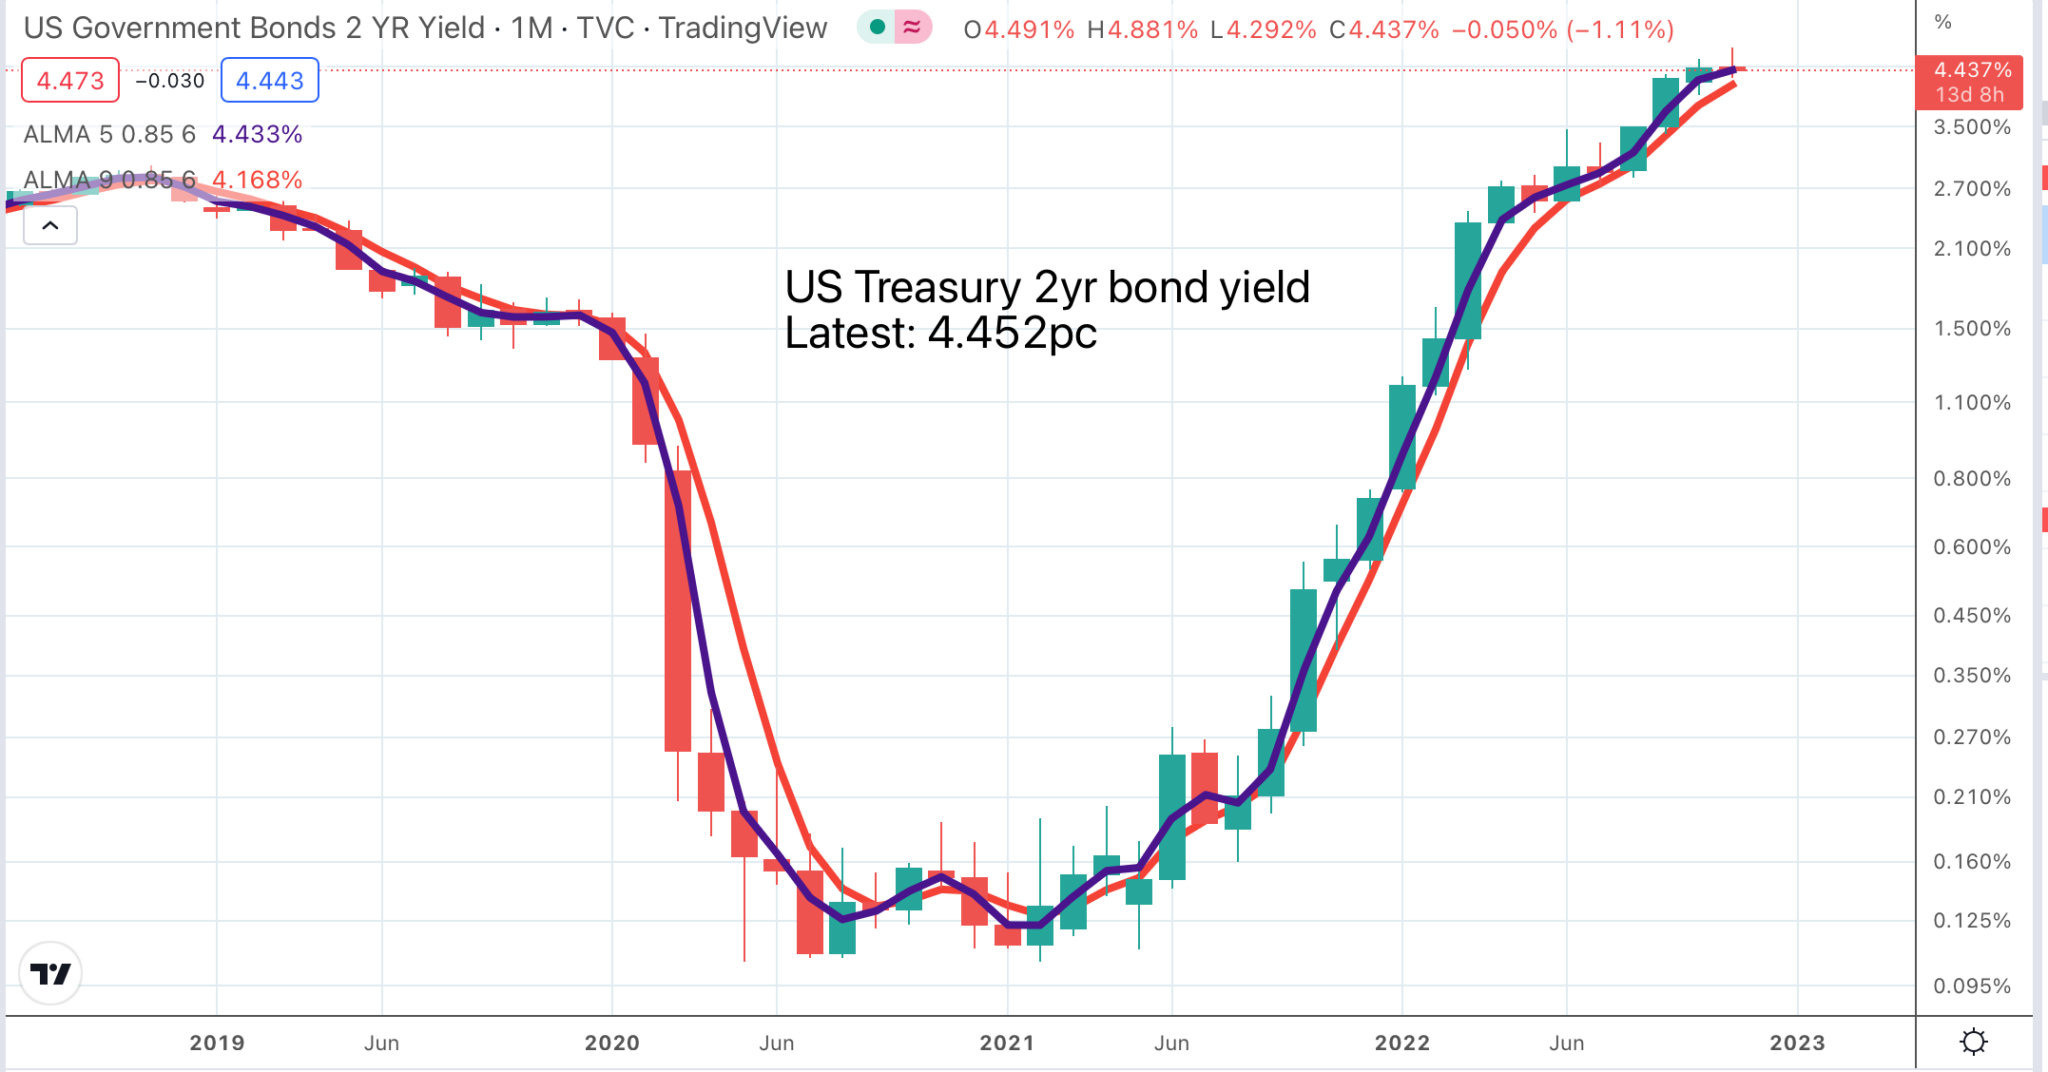

The chart above shows the yield on US Treasury 2 year bonds. The chart below shows the yield on US 10 year bonds. The normal state of affairs is that if you lend your money to the US government for a longer period of time like 10 years you get a better return than if you lend for two years. If this pattern is reversed, as it is presently, this is known as an inverted yield curve and reflects investors’ expectation that long term yields are going to fall. An inverted yield curve is an indicator that investors are expecting a recession.

It seems logical that we are going to get a recession.The only way for the authorities to fight inflation is to try to squeeze it out of the system. Remember my metaphor of squeezing the lemon. If they just accommodate it as has been practised in numerous South American countries inflation has a distressing tendency to get higher and higher until it spirals into hyper inflation and wheelbarrows full of money in the streets.
The moment when inflation + tight money = recession is always a crunch time for stock markets and it is probably happening just about now. This is why in general equity markets look weak.

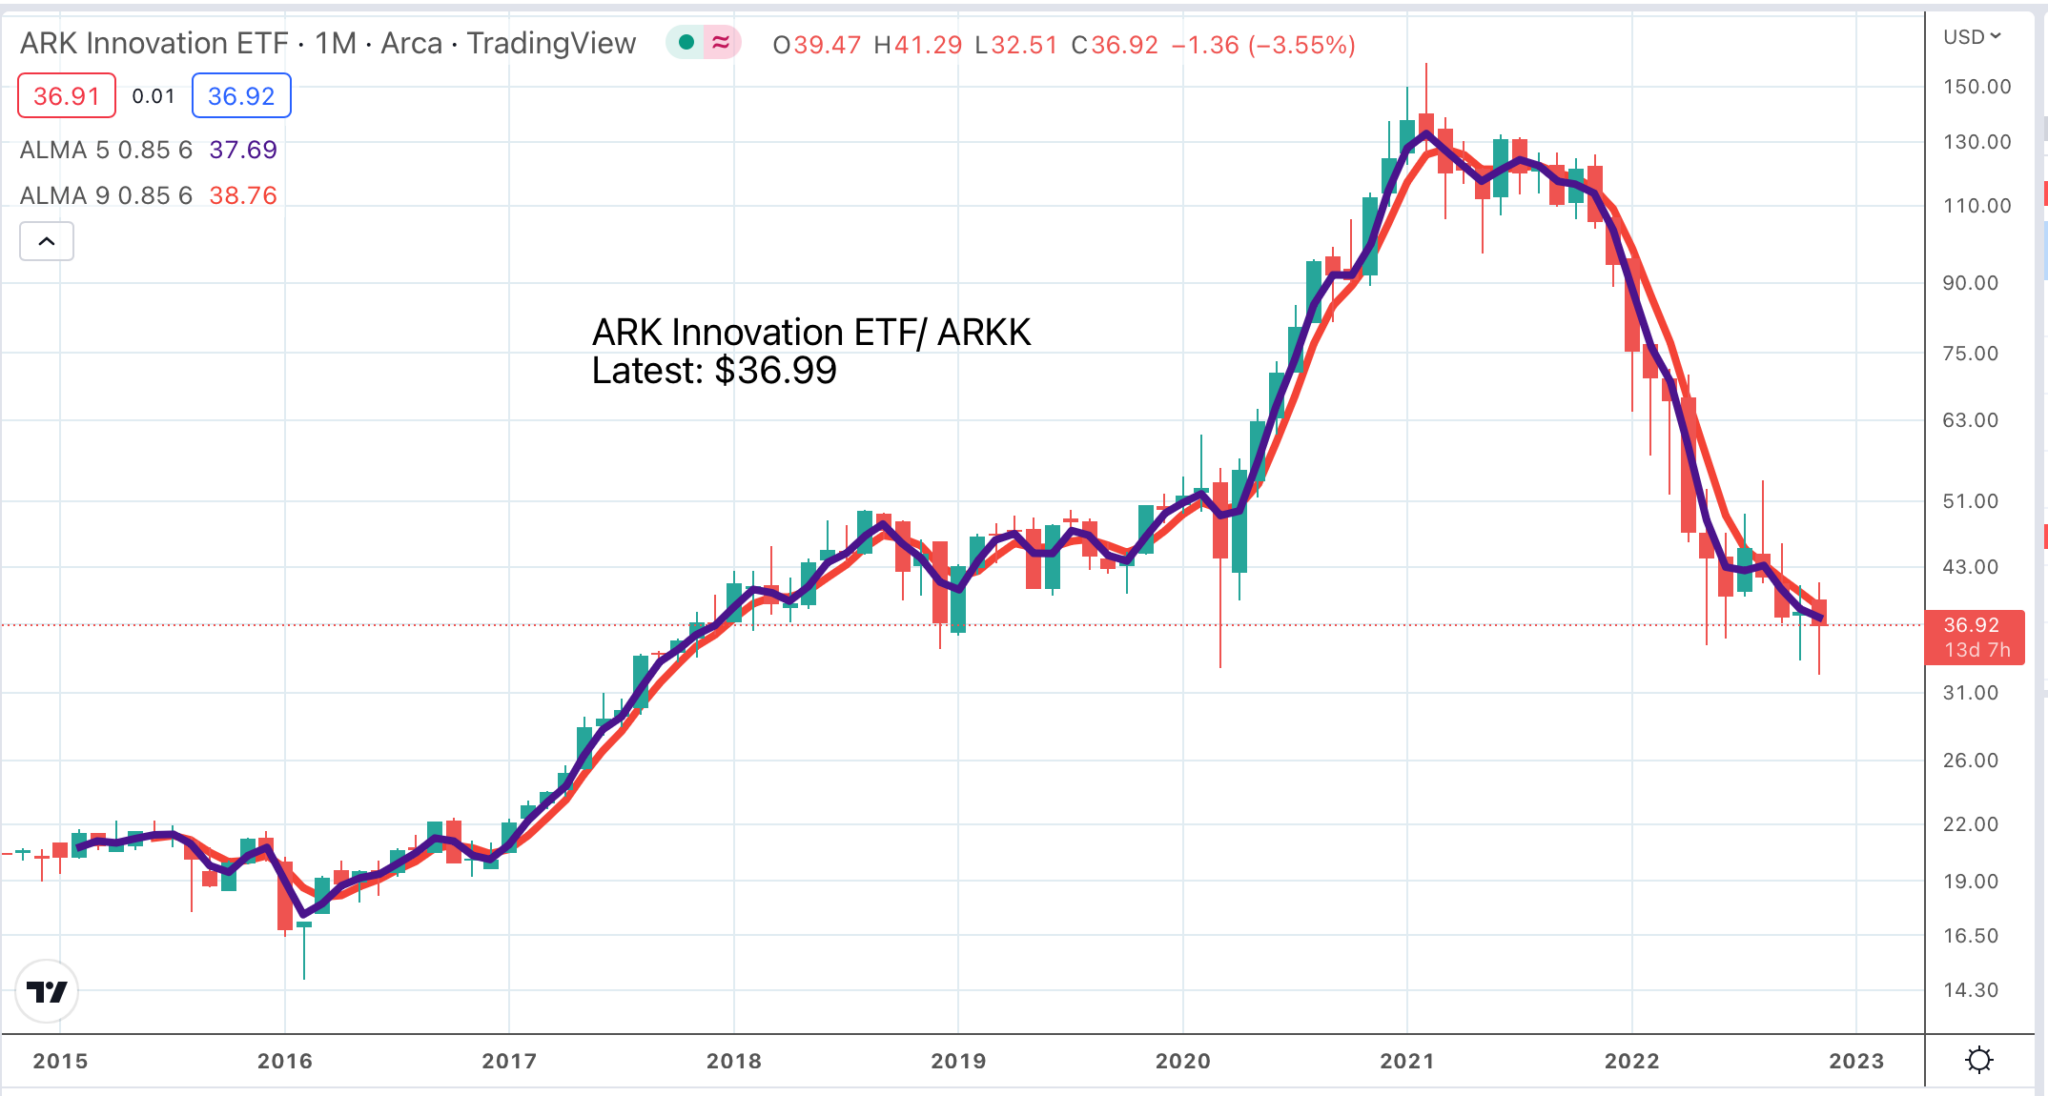
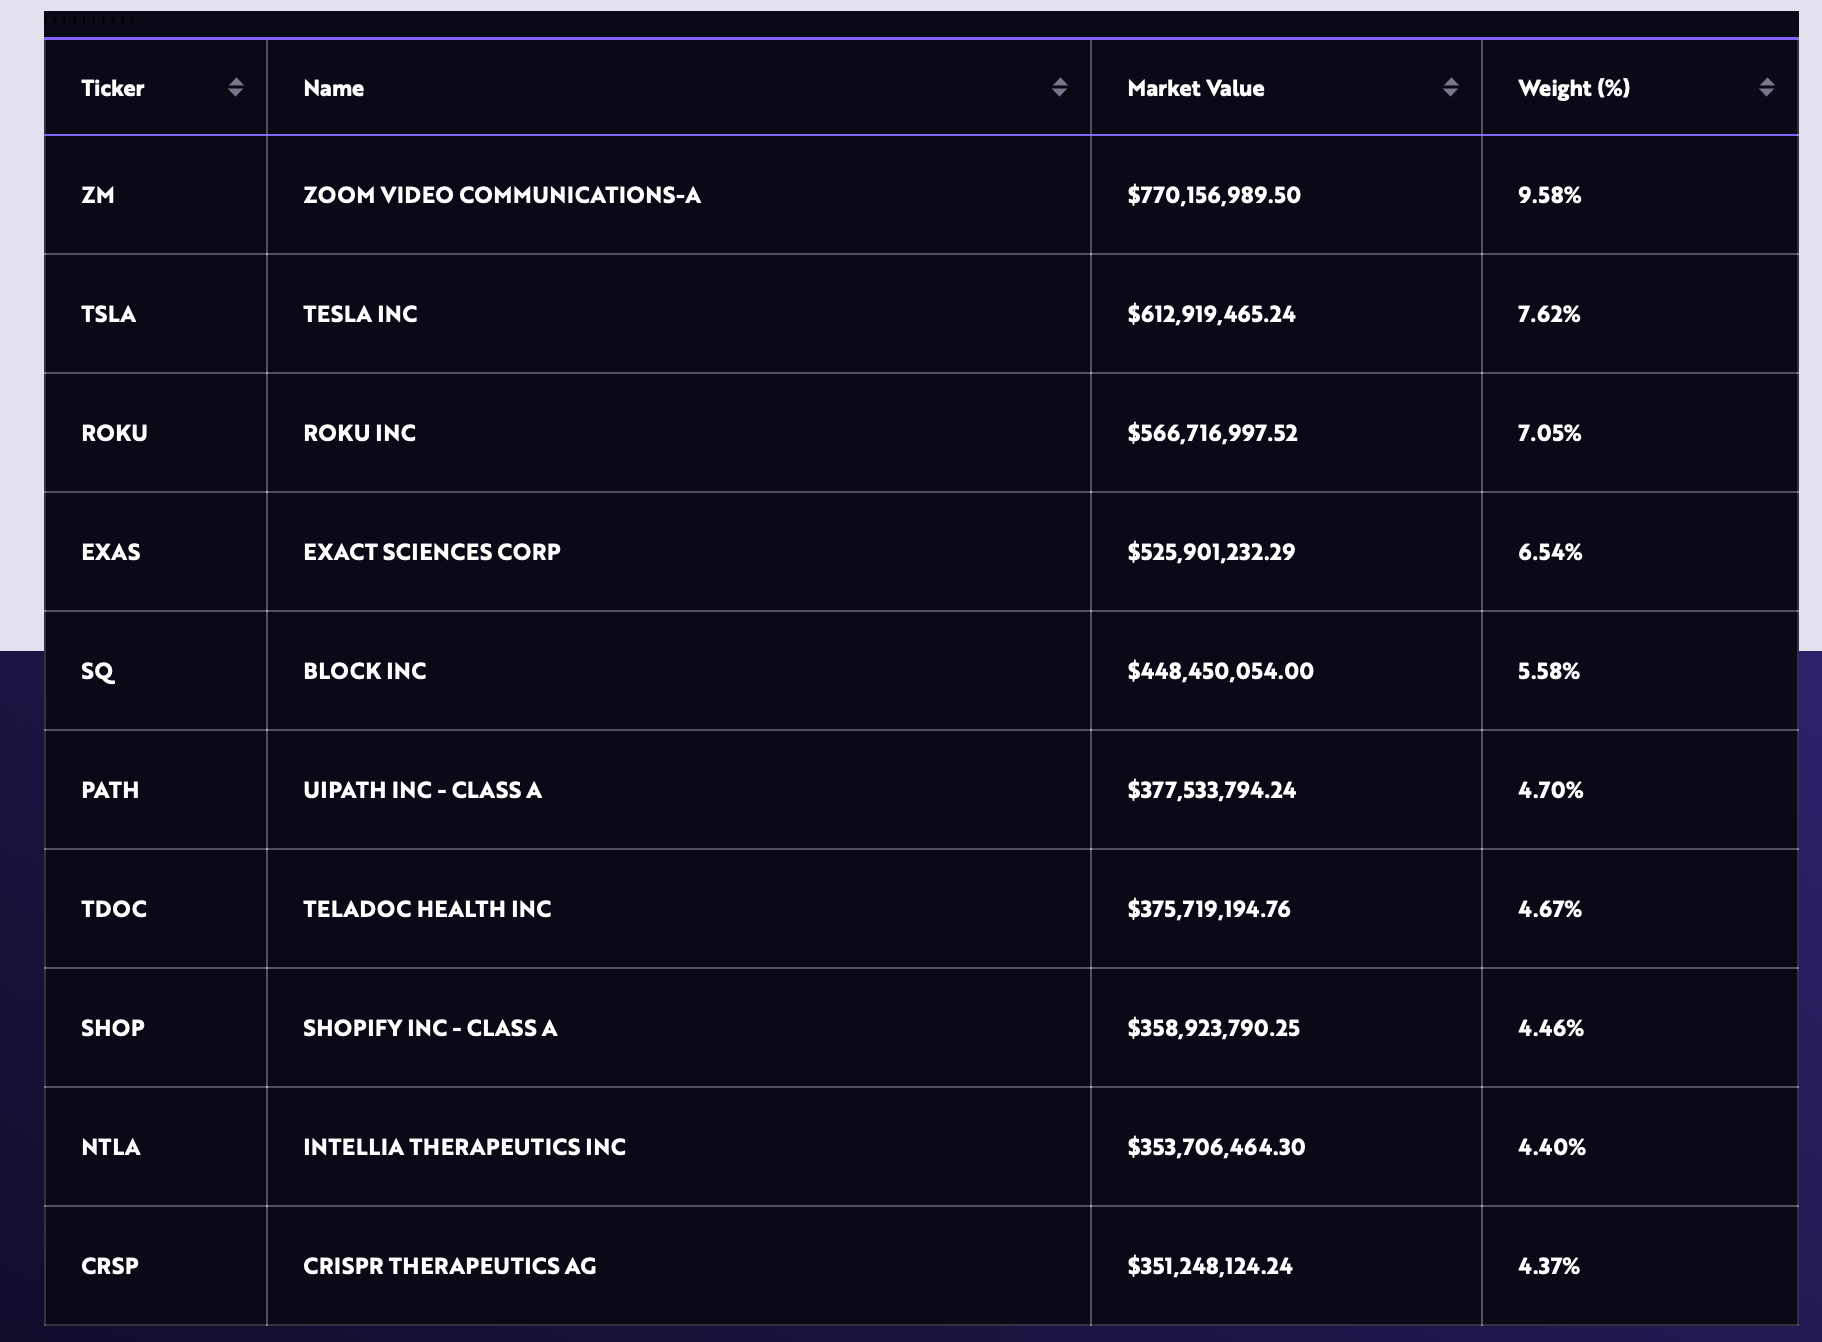
Above is a chart of the ARKK ETF managed by Cathy Wood and her team. It is an unusual ETF in that it is actively managed. If you are familiar with the US stock market you can see that she is holding shares in companies (see below) which have been hammered in the bear market.
There is no sign yet of a change of direction by ARKK shares and the Coppock line is down to minus 132 which is the most minus it has ever been for this share. The line of support around $36.50 looks important. If the price breaks down sharply from here that would suggest a move to significantly lower levels like $20 but I suspect that is not going to happen.

I have had a look at the chart at the chart of Zoom Video Communications which was a superstar of the WFH (work from home) bull market
Incredible to think these shares peaked at over $580, when they are now $81.40. Talk about what goes up must come down. This is partly about a steep fall in profits as demand goes off the boil but also about a huge drop in the multiple of revenues at which the business is being valued which has dropped from 40 times to five times. The Coppock indicator has declined from a first calculated plus 705 to minus 132. The buy signal when it comes will be the first ever by Coppock for Zoom Video.

There is another chart (see below) which is a key member of my benchmarks list, FNGU (Microsectors FANG 3x leveraged), which is a three times leveraged fund tracking the mega caps. You can’t buy them on IG so I just follow them for interest. Like a lot of technology-focused charts we are seeing that all the gains made during the lockdown era have melted away. It seems unlikely that they are going to fall a huge amount lower. More likely they will start to build a base somewhere around the current price.
The Coppock indicator rose from December 2019 to February 2021 and has been falling ever since. It is currently minus 158.5. One day it will be time to buy.

Strategy
We are still in an ongoing bear market. My feeling that the market might be in a bottoming out process is just that so far. Buy signals are very few and far between. There is one for a financial services stock called Fair Isaac (FICO) which is hitting new peaks and even has a rising Coppock but I am not ready to start buying individual stocks yet even if they are total 3G like Fair Isaac.
The latest results were very good.
I’m pleased to report that we had a very good quarter which completed an outstanding year with record revenues, record earnings, and record cash flows. We easily exceeded our guidance in all areas even after a mid-year raise.
9 November 2022, Q4 2022
At one time it seemed that a company called Upstart was going to eat FICO’s lunch but since then UPST is down from $406 to $19 and has been lower.
I am thinking that I am going to use QQQ3 and OGIG as the canaries in the mine. Until I start making money from my investments in these two I am not going to invest in anything else. Successful investing is based on building from a winning position. Until I start winning I am not really going to start investing.
If my theory is right OGIG shares (see below) should be tracing out the head of what is going to become an eventual head and shoulders reversal pattern. We shall see.
One thing that could be happening is that there is nobody left to sell. All the momentum guys should be out by now so you have to ask yourself why would anyone wait until now to sell unless their strategy was never to sell; that is one reason why these shares could be bottoming out.


