
More on breakdowns as outlook for shares and cryptos deteriorates further
We are in a raging bear market, which is shaping up to be as devastating as the earlier ones in 2003 and 2008. There is a massive reset taking place in stock markets and the markets for cryptocurrencies and both instruments need to find a level. Bond prices are also falling as rising yields are the reciprocal of falling prices.
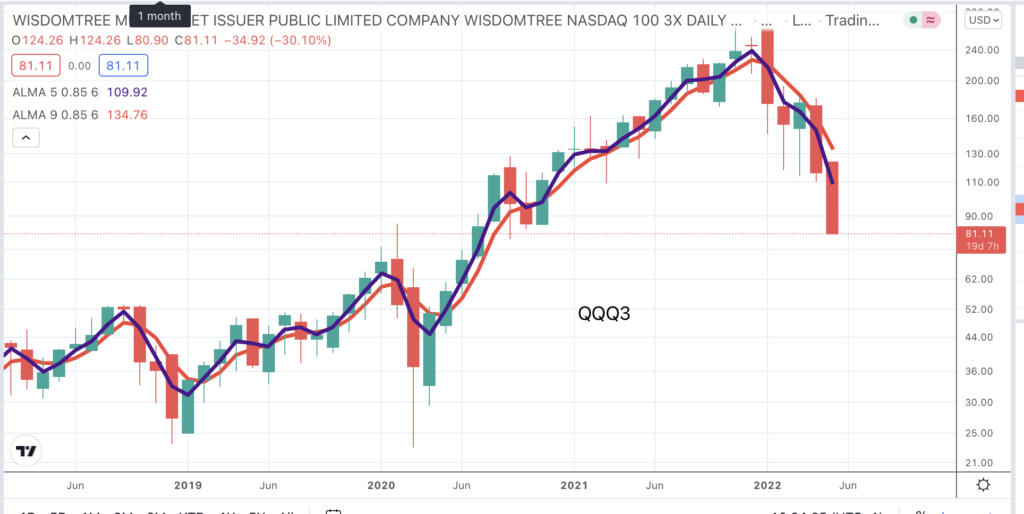
In this issue I am going to look at some key bellwether charts. Above is the chart for QQQ3, an indicator which is calculated in such a way that it at least triples the moves in the underlying Nasdaq 100 index. In five months it has declined by 61pc from 208 to 81. It could easily fall much lower – 20 anyone? Who knows?
What we do know is that if it does fall to 20 the next buy signal will be a screamer. So I will be keeping a close eye on this chart. How will we know when we have a buy signal? The moving averages will change direction but before then the Coppock indicator will stop falling and start climbing, most probably from a negative position.
Coppock is a weighted momentum indicator. It really is a very clever indicator, which exaggerates the movements in whatever investment instrument it is tracking. QQQ3 is down from 208 to 81 but its Coppock indicator is down from 334 to 60. It also has this extraordinary ability to turn negative, thus confirming that we have had a serious bear market and gives a buy signal by becoming less negative. It’s brilliant and I will keep you posted on developments.
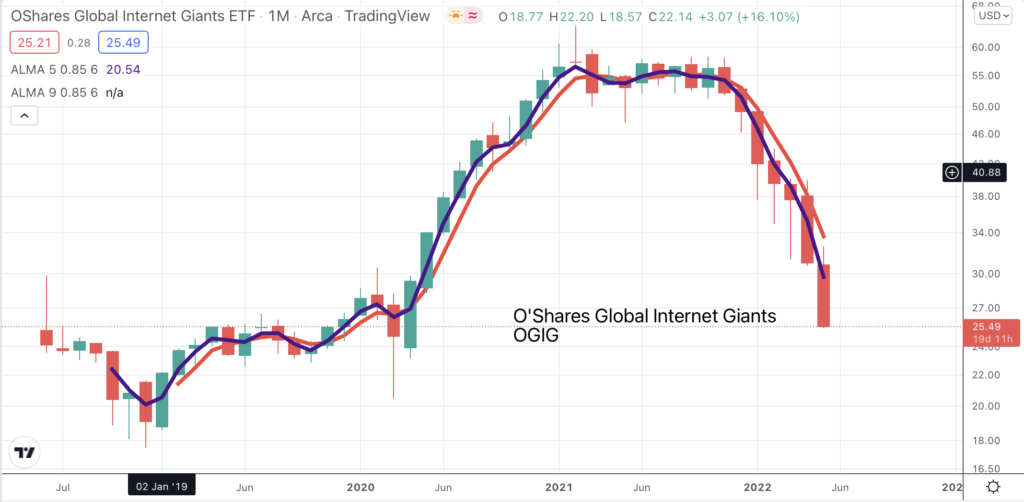
Another key bellwether chart is OGIG, which I keep referring too. It is an ETF which has a classic high growth, high momentum portfolio stuffed with technology shares and it is taking a hammering. OGIG shares are down from $64.4 to $25.5 but its Coppock indicator has dropped from 201 to -54. The shares are testing major support which may mean that they are going to start a base building process. OGIG has been caught out by its holdings in sexy smaller higher growth technology shares and Chinese technology shares, both areas which have taken a massive beating. Now its other area of investment, the technology mega caps is coming under pressure so the shares may yet weaken further. One lesson of a bear market is never buy shares just because they have dropped a long way. Unless they are zero they can always fall further.
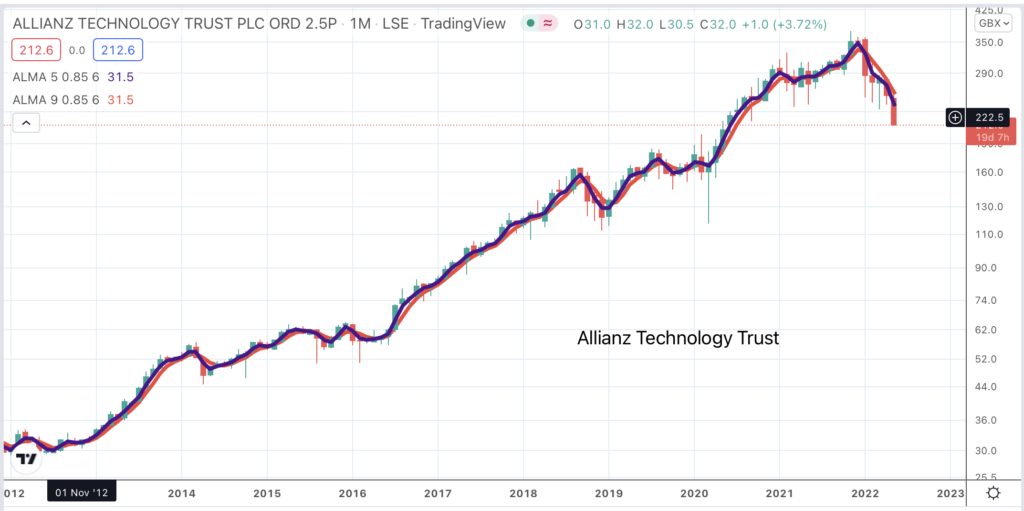
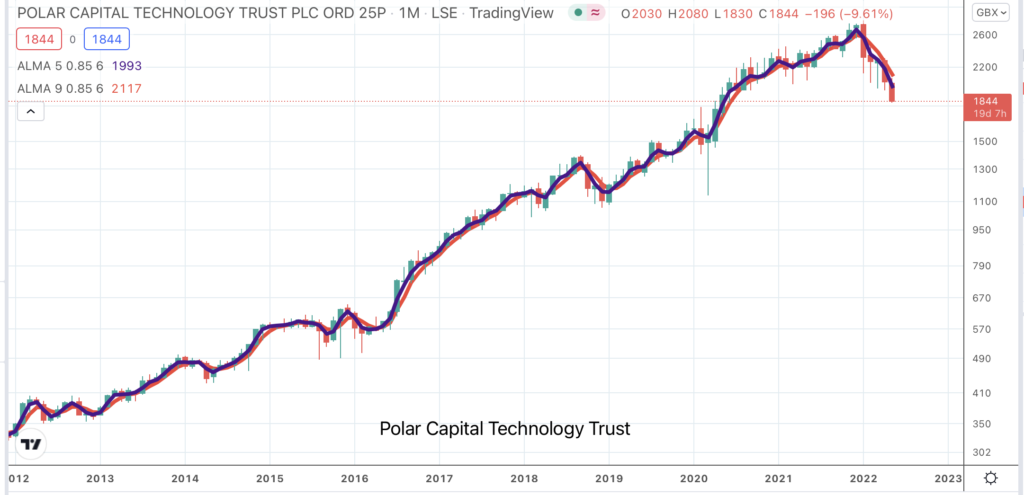
I mentioned Allianz Technology Trust in a recent alert as having an alarming chart. Its even more alarming now with a clear breakdown from a significant top area. Seven times in the last 18 months the price has found support around 240p; not any more. It has broken down confirming all that trading as a top area and the shares are in a full-on bear market. The same applies to Polar Capital Technology Trust, which has a similar looking chart except that the top area extends back two years. The incredible message of these charts is that the most severe phase of the bear market may be just beginning. A chartist friend of mine used to say that in order to crash the plane must first fly. These shares (PCT) have flown high indeed, rising from a low of 118p in 2009 to almost 2,800p as recently as January 2022.
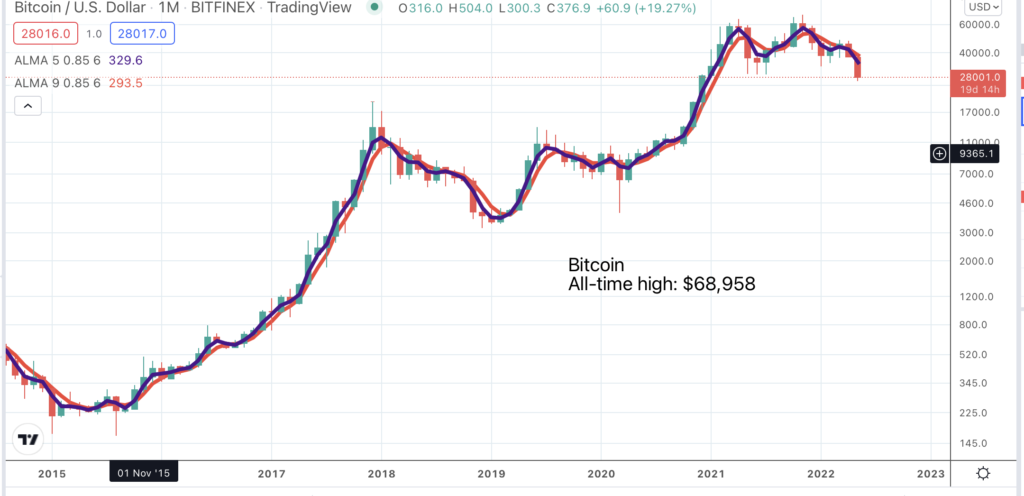
What is the latest on cryptocurrencies. My reading is that they have broken down and significantly lower levels may lie ahead. This is going to be a real test of nerve for the bitcoin whales. The chart looks terrible and the return on a billion dollars in the bank is looking more attractive every day. As you can see from the chart it nearly always pays not to hold bitcoin when the moving averages are falling and to buy back in when they start climbing again. We can also look at Coppock and that is falling fast, down from 706 to 115.
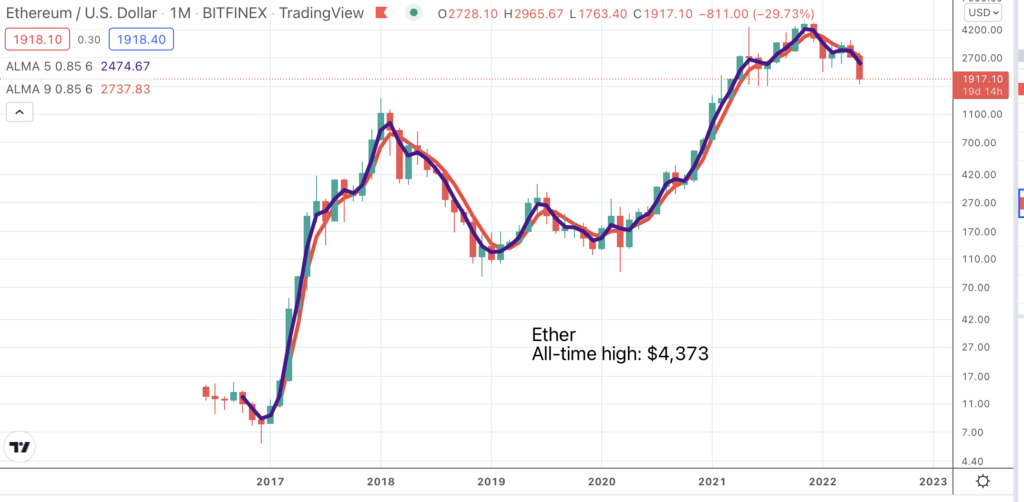
The chart for ether looks similar. It is a little better than the bitcoin chart because of the earlier support around $1850 but the latest price action looks like a breakdown from an upward sloping area of consolidation and if it starts to fall sharply from here there is no support above $400. Both the key cryptos are look very dangerous to hold at this time.
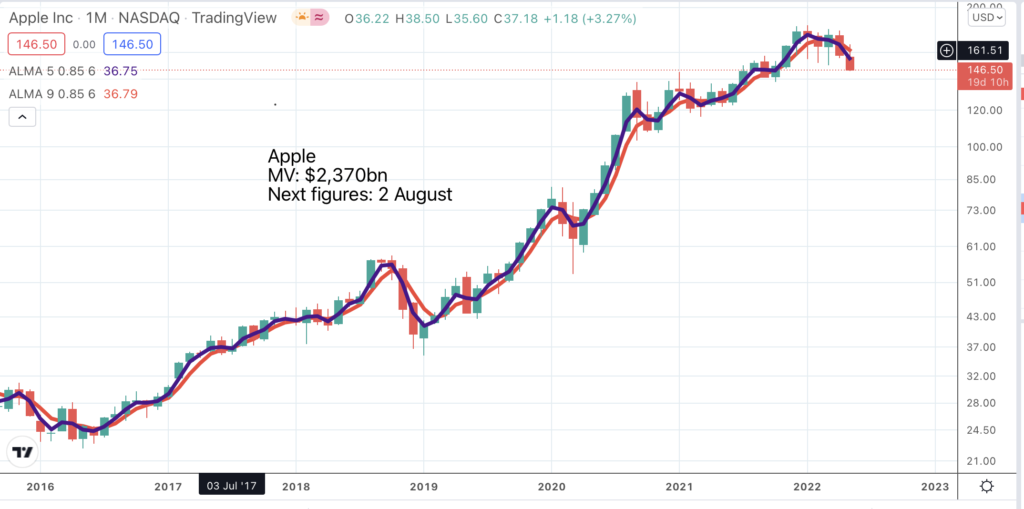
Last but not least is the battle for Apple. As noted recent results were excellent but that has not saved many other shares in this bear market. There are signs of a chart breakdown on the US stock markets key bellwether stock. It is not a huge top area but there is a clear dead cross by the moving averages (shorter average falling below falling longer average) and the Coppock indicator has been falling since January 2021 and may now start to fall more steeply.
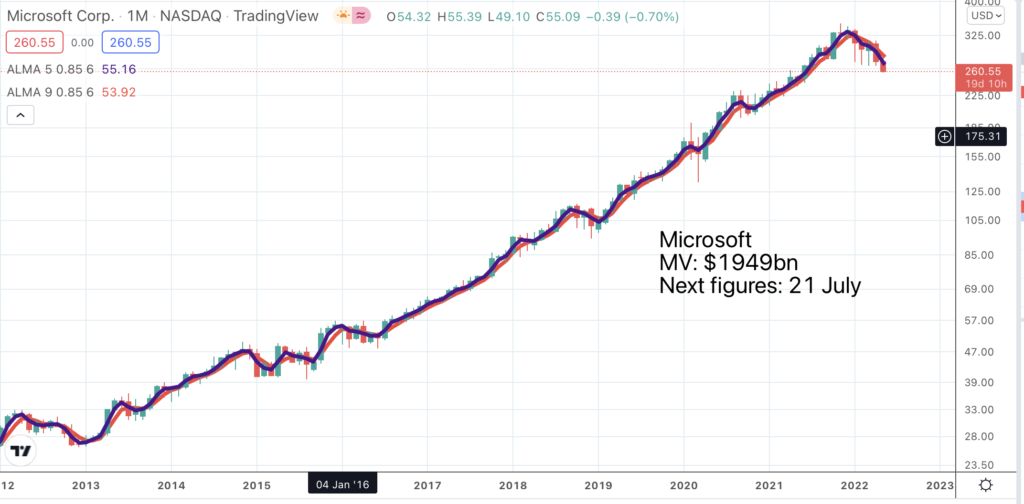
The other giant mega cap, Microsoft, has just seen its value fall below $2 trillion and is in a similar position to Apple. Its latest results were excellent but that has not saved the chart which, in my recent terminology, is unequivocally bearish and suggests lower levels ahead.

This market is all about charts. Great fundamentals are just interesting history. It’s all about what is going to happen to inflation and interest rates. If there is worse to come on both those fronts markets will fall further, which is exactly the outcome being suggested by the charts. Bear markets don’t last forever but this one has only been running for a few months. It would be no surprise if there is more pain to come and more work to do until a new bull market can begin.
The hopeful sign is that there was a huge bull market in the 1980s which crashed and burned in the early 1990s. At the time it seemed that a historic period of rising share prices had ended never to be seen again. Not a bit of it. When the next bull market began in 1992 it was even bigger and better than the 1980s. Shares like going up; that is what they spend most of the time doing. Bear markets are aberrations but we have got one now.


