This is a six monthly candlestick chart of the Nasdaq 100 Technology Sector index. It is on the cusp of giving a double whammy buy signal with Coppock already bullish and the shorter term (blue line) moving average having clearly turned higher. Previous such buy signals have been highly successful.
It is a great list. Twenty of the top 30 listed constituents are QV benchmark stocks. It is an equal weighted list so does not have the need for the special rebalancing which is about to take place for the Nasdaq 100. This also means it has underperformed the Nasdaq 100 which has been driven higher by the soaring prices of the mega caps.
What the chart does tell us is that we are going to find a growing number of shares in smaller cap technology businesses which are doing well and so we do. Some exciting performers are discussed below.
Table of Contents

Hubspot – Great Chart, Outstanding Prospects
The shares have a great chart (see above) and the company is doing well and has outstanding prospects (see below).
“We had a strong start to the year and I’m pleased with the focused execution of the HubSpot team,” said Yamini Rangan, Chief Executive Officer at HubSpot. “Our results show that our product innovation is in high gear and that our bi-modal go-to-market strategy is working. We continue to operate in a tough macroeconomic environment but we have a solid playbook for executing and driving sustainable growth despite this challenge. At the same time, we are in the early stages of a transformative shift brought on by Generative AI. HubSpot is well positioned to help go-to-market teams be even more effective with AI, and we’re incredibly excited by the opportunity it is creating to deliver even more value for customers.”
Yamini Rangan, CEO, HubSpot, Q1 2023, 3 May 2023
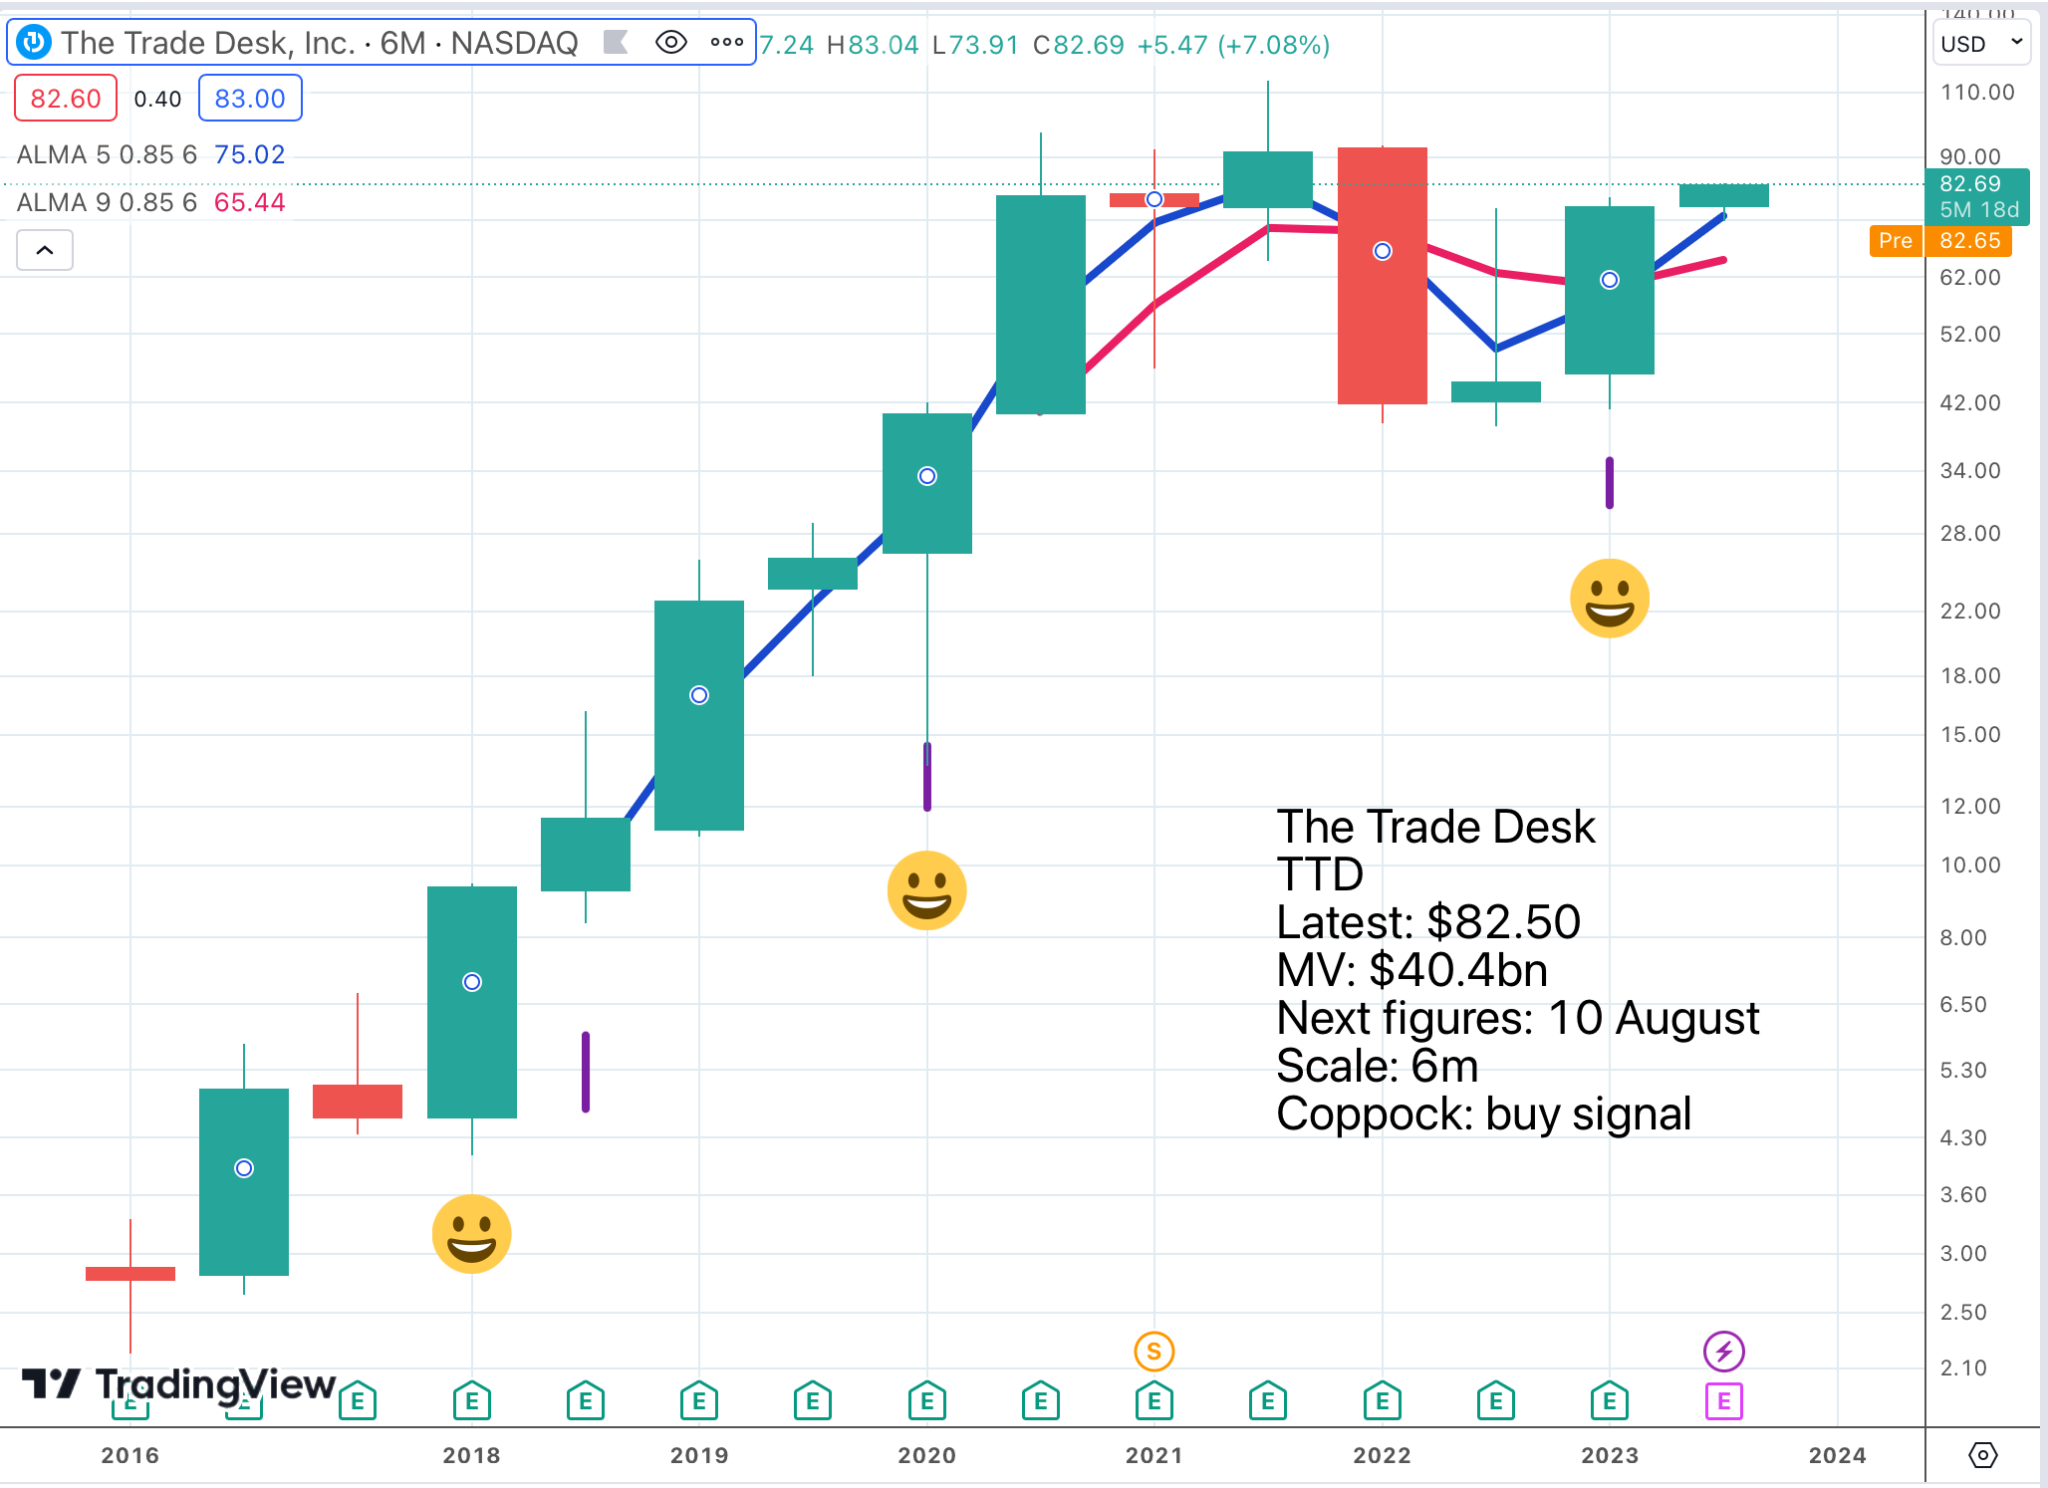
The extraordinary thing about this chart, and others, is just how potentially strong it is, with the shares trading within a consolidation area that already stretches back three and a half years. A decisive break through $100 would be an exciting development. We already have a double whammy buy signal from Coppock and the moving averages, which strongly suggests that the pattern we are seeing forming is not a top area but a continuation pattern likely to take the shares higher.
CEO and founder, Jeff Green, is a wonderfully ebullient individual, many successful entrepreneurs are, and he has been consistently bullish on prospects for his business.
The Trade Desk’s Jeff Green is as Bullish as Ever
“We delivered outstanding performance in the first quarter, once again outpacing the digital advertising market, growing revenue 21pc year-over-year to $383m. Our strong start to the year is testament to the increasing value that marketers place on objective, transparent, data-driven media buying on the open internet,” said Jeff Green, Co-founder and CEO of The Trade Desk. “2023 is already proving to be a pivotal year for our industry. The shift from linear to connected TV continues to accelerate and fully decisioned programmatic will feature more prominently than ever at this year’s upfronts. At the same time, more leading marketers are leveraging new innovations, such as shopper data, to better understand the relationship between campaign activity and consumer action. As The Trade Desk continues to innovate in these and many other areas, we are well positioned to deliver premium value to our clients and gain share.”
Jeff Green, CEO, The Trade Desk, Q1 2023, 10 May 2023
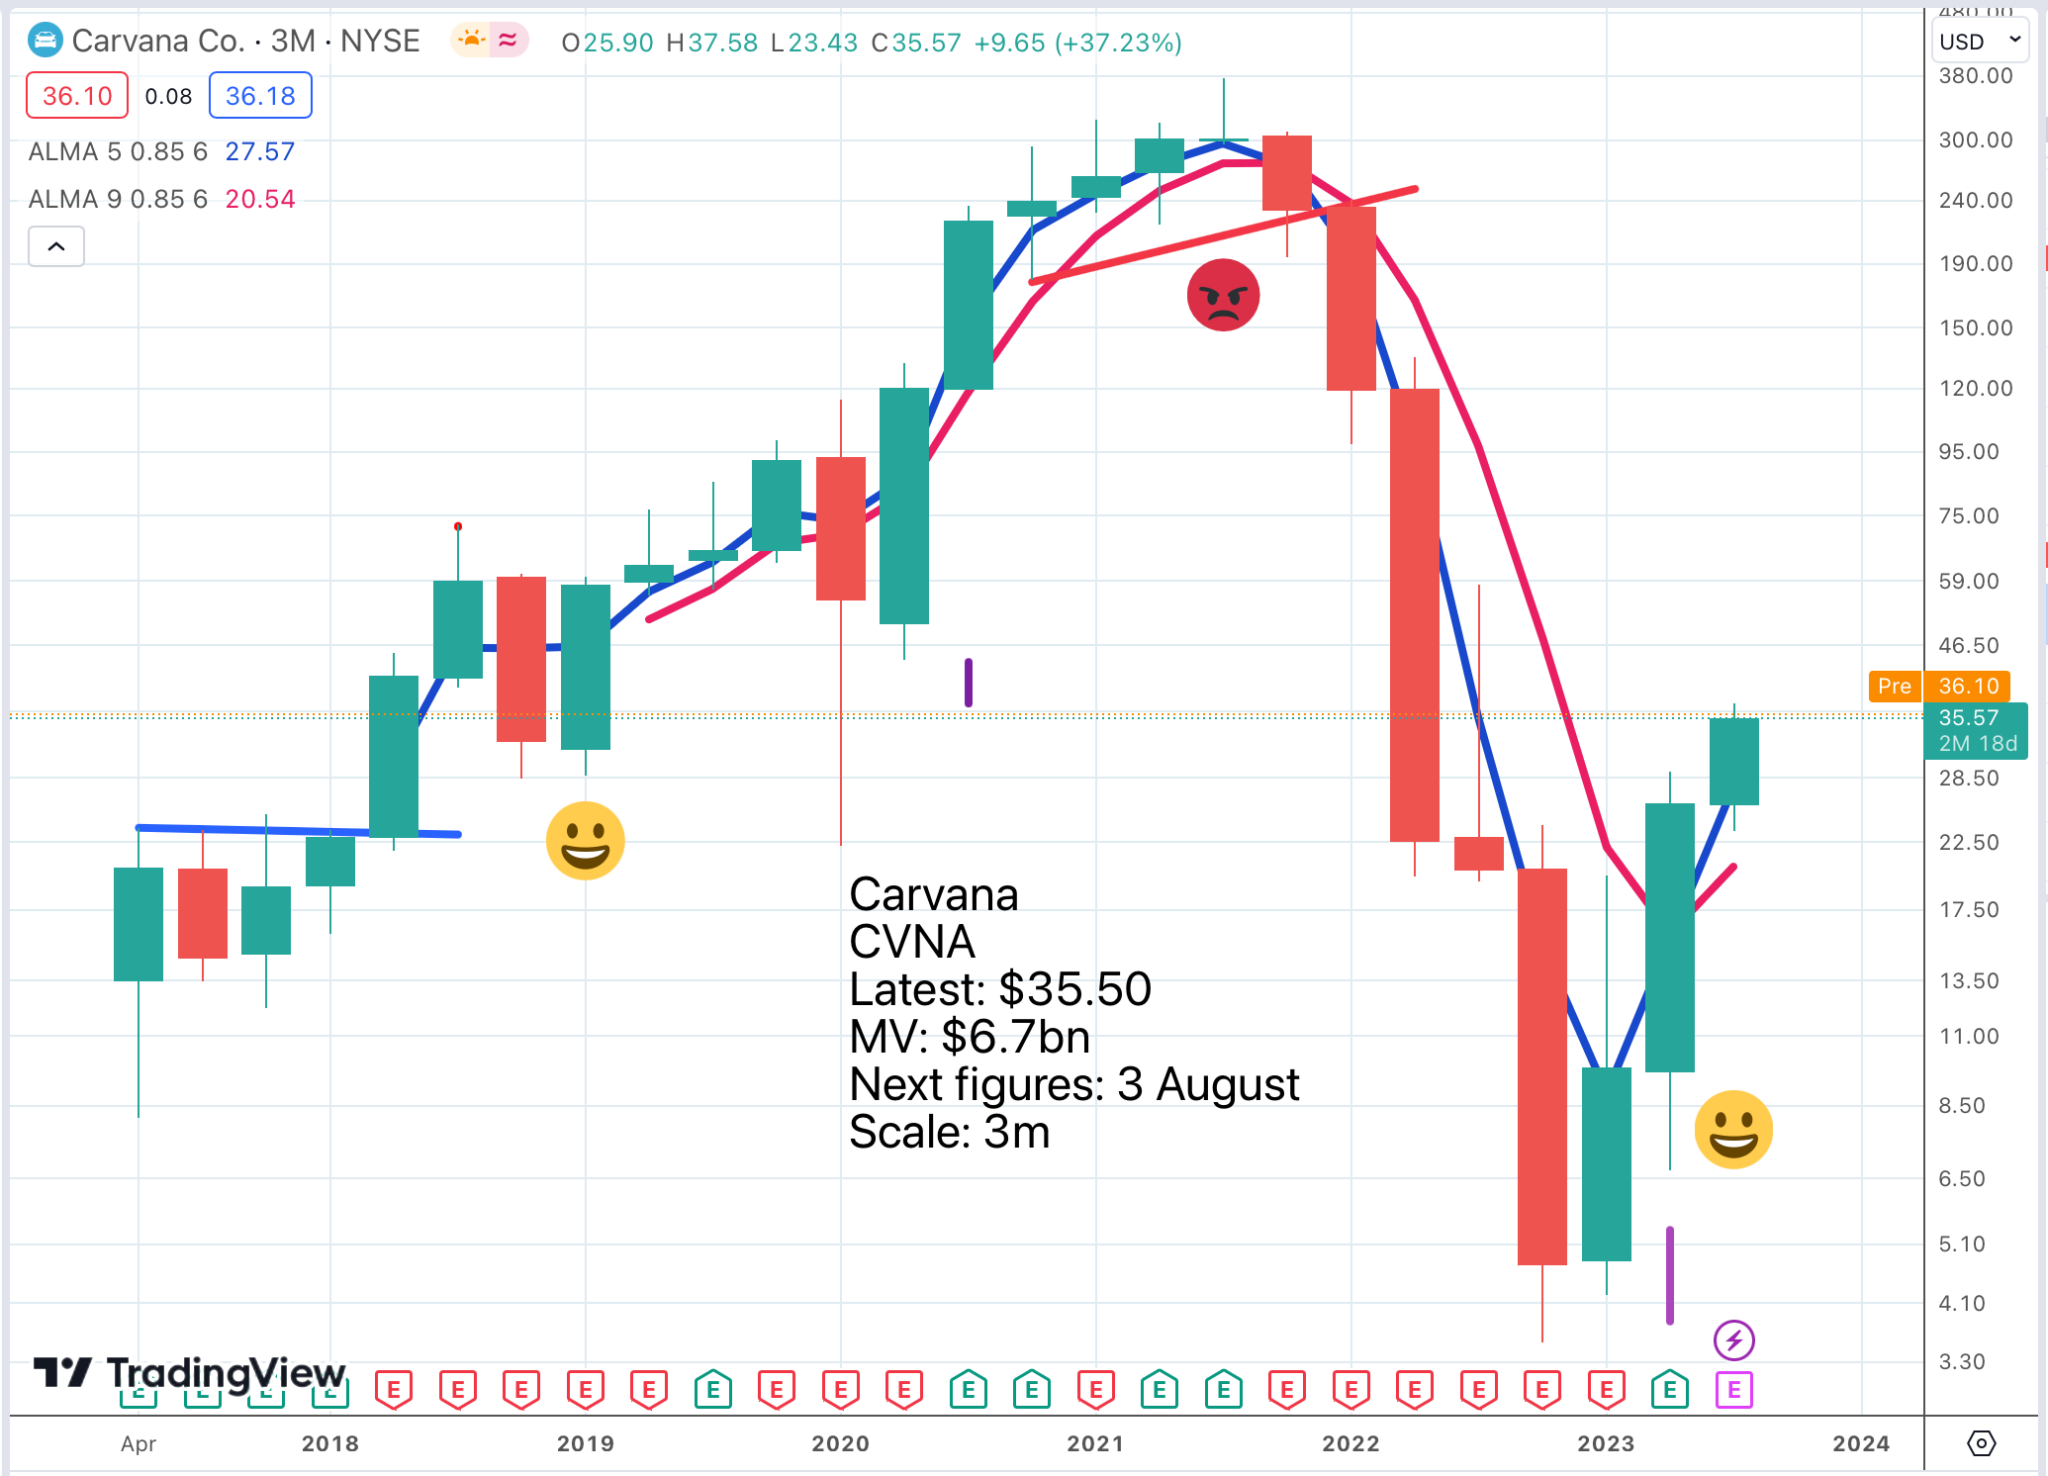
The Carvana chart has the usual double whammy buy signal but this is happening at prices way below the previous peak. This is a company which many investors believed might not survive. Rather like a UK quoted company called Ashtead, an equipment rental business, which nearly went under early in the millennium but is now a stalwart of the FTSE 100, Carvana borrows to fund its stock of equipment, in their case, used cars.
At a time when used car values were falling, interest rates were soaring and demand was faltering the company looked very exposed but as long as they can survive they will emerge fitter and stronger and the basic business model for disrupting the huge US used car market is still a good one. They also have a talented management team, somewhat chastened now, but older and wiser and still with a large stake in the business.
Carvana Management in Full Survival Mode
This is what is happening.
The first quarter illuminated the path we are on to execute our three step plan to increase profitability and to return to growth. Our progress is highlighted by the fact that we achieved company‐best first quarter GPU and Adjusted EBITDA margins. In addition, we completed our Q2 SG&A reduction goal one quarter early despite a difficult macroeconomic and industry environment as well as a tremendous amount of change that has been occurring in our business to adjust to the environment.
We are extremely proud of the direction and speed of this progress and we are extremely grateful to the incredible people inside Carvana that are working so hard to make it possible, but we still have a long way to go to achieve our goals and as a result we remain laser focused on the steps that remain in front of us.
Letter to shareholders, Q1 2023, 4 May 2023
And this is where they think they are going.
The last twelve months have made it harder to see, but we remain firmly on the path to changing the way people buy and sell cars and to becoming the largest and most profitable automotive retailer.
Letter to shareholders, Q1 2023, 4 May 2023
Below highlights the impressive footprint the business already has which explains why they are able to take such decisive action to put themselves back on track. They have switched from headlong expansion to, as they describe it, a laser focus on profitability and cash flow, just like Ashtead back in the day and the medicine is working.


Fortinet Smashes It on the Rule of 40
Fortinet is a newcomer to the Quentinvest tables but is clearly 3G and with plenty of magic. The chart above uses six monthly candlesticks. These come into their own after a significant setback in the stock market such as we had in 2022. It is not guaranteed but most of these 6m double whammy buy signals work very well and we have a classic one now for these shares.

As they say their execution has been amazingly consistent. The Rule of 40 simply says that revenue growth plus operating margins should exceed 40 and for this company most years it does and even when it doesn’t the shortfall is not very much.

Below ia what management consulting giants, McKinsey, said about the rule of 40 and why it is so important.
The popular metric says that a SaaS [software as a service] company’s growth rate when added to its free cash flow rate should equal 40 percent or higher. The rule has become a favorite of SaaS industry watchers, including boards and management teams, because it neatly distills a company’s operating performance into one number. But McKinsey research finds that barely one-third of software companies achieve the Rule of 40. Fewer still manage to sustain it. Analysis of more than 200 software companies of various sizes between 2011 and 2021 found that businesses exceeded Rule of 40 performance only 16 percent of the time.
McKinsey, 3 August 2021
FTNT’s Business Growing as Strongly as Ever
For the first quarter, revenue growth was 32pc due to strong growth in both product and service revenue. With 35pc product revenue growth, we continue to gain market share while being a leading product revenue company in the cyber security industry. This strong product revenue growth will help drive future service revenue growth.
Quarterly service revenue grew over 30pc for the first time in 6 years. We believe we have a significant opportunity to upsell value-added security services to our large installed base. In the first quarter, SD-WAN and OT bookings together continued to account for over 25pc of total bookings, and our goal is to become the #1 in Network firewall, Secure SD-WAN, and OT security markets over the next couple of years.
Fortinet is leading the trend of network and security convergence and cyber security consolidation. Gartner expects that by the year 2030 the secure networking market will be larger than traditional networking. Traditional networking lacks awareness and control of content, applications, users, devices, and location and is still using the same network protocol that was developed 50 years ago. Fortinet’s secure networking solution has expanded from Next Generation Firewalls to SD- WAN, SD-Branch, 5G, internal segmentation, ZTNA and Universal SASE, and we believe, the secure networking market can achieve double-digit growth annually for the foreseeable future.
As networking and security continue to converge and customers look to consolidate vendors and point products, we believe we are well positioned to achieve our 2025 billings target of $10bn [this compares with $1.26bn for Q1 2023] while generating an annual Non- GAAP operating margin of at least 25pc for each of the next three years.
Ken Xie, CEO, Fortinet, Q1 2023

OGIG Shares Move in Long Swings
My indicators work best when shares move in long swings, up and down. OGIG is an excellent example and you can see from the chart how well my indicators are working. The shares are heading higher and are firmly in buy and hold territory.
The 20 largest holdings have all been featured in Quentinvest.
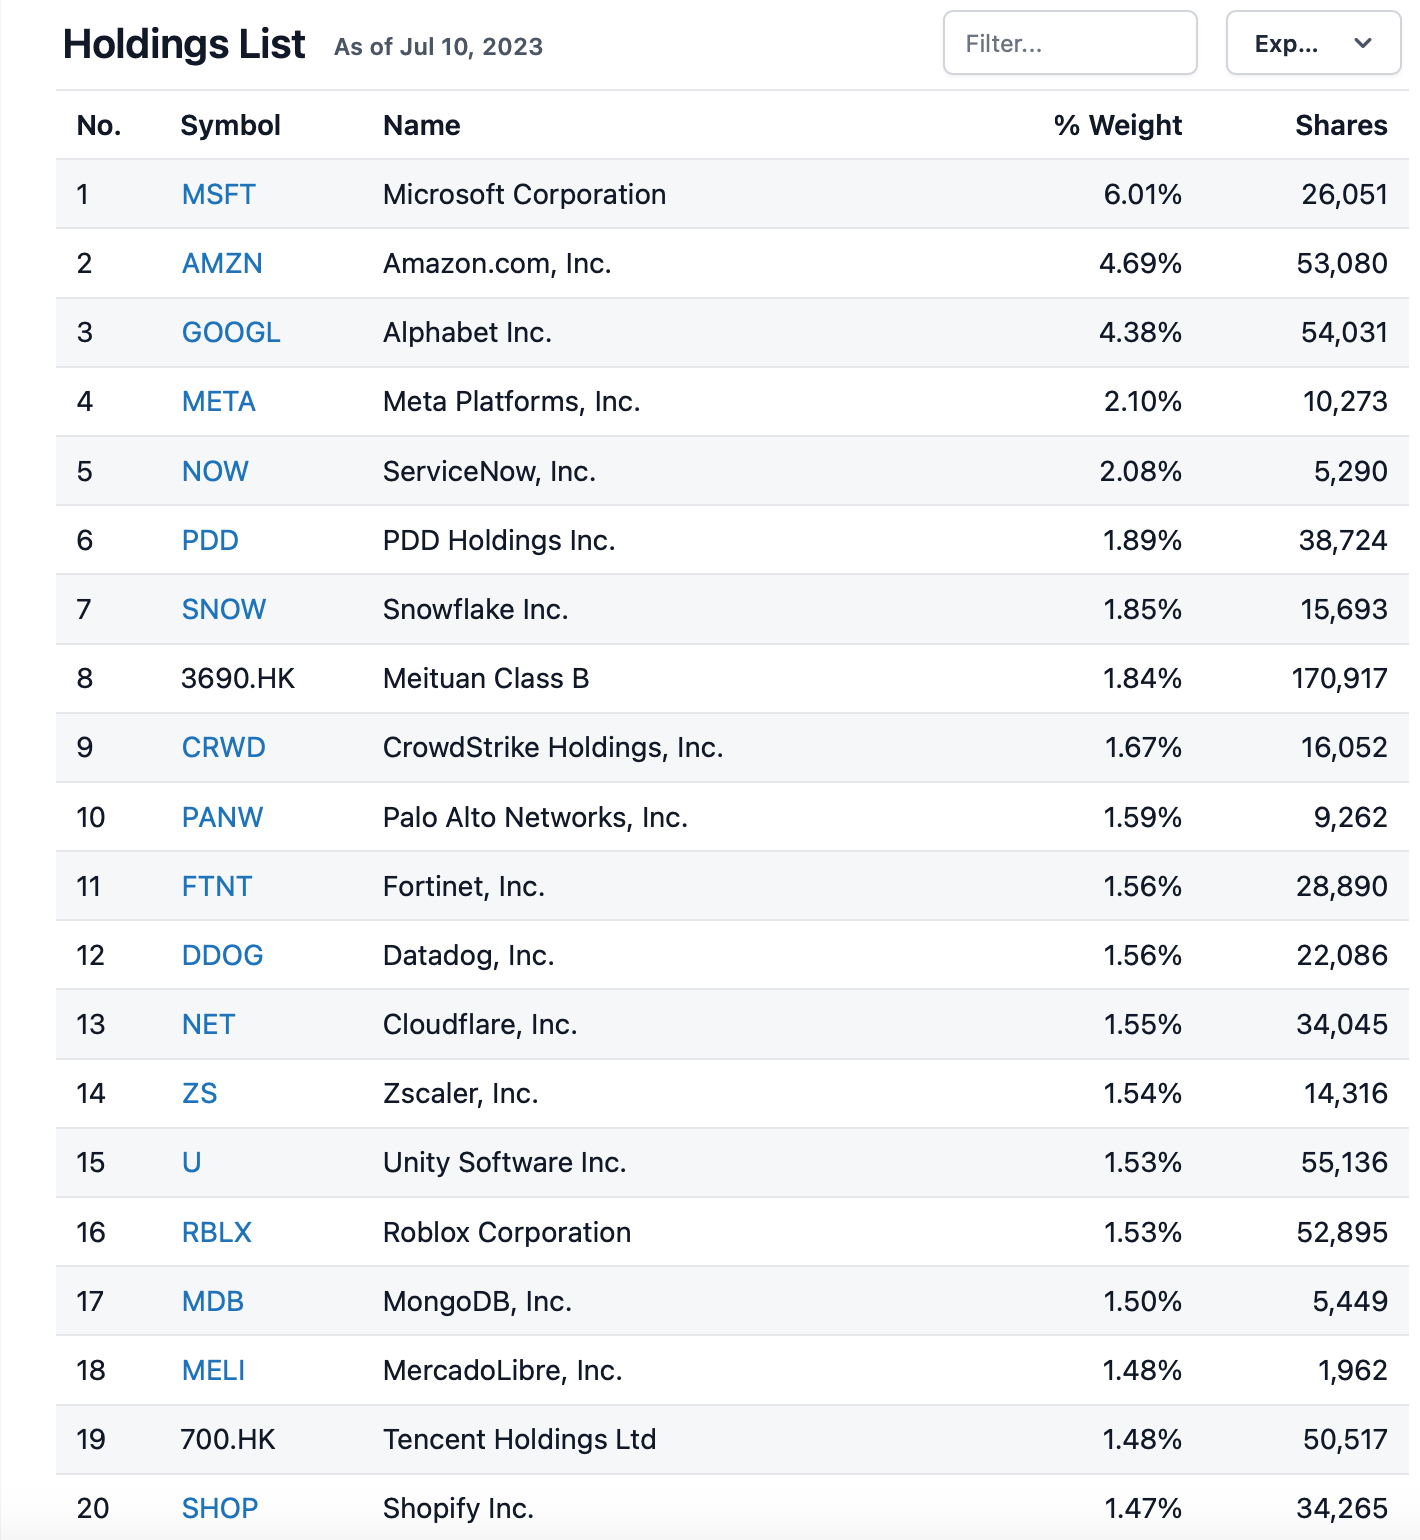
The shares held are very much focused on e-commerce and Internet security which explains why semiconductor giants like Nvidia do not feature. My guess is that as the bull market becomes more general the shares will do well.
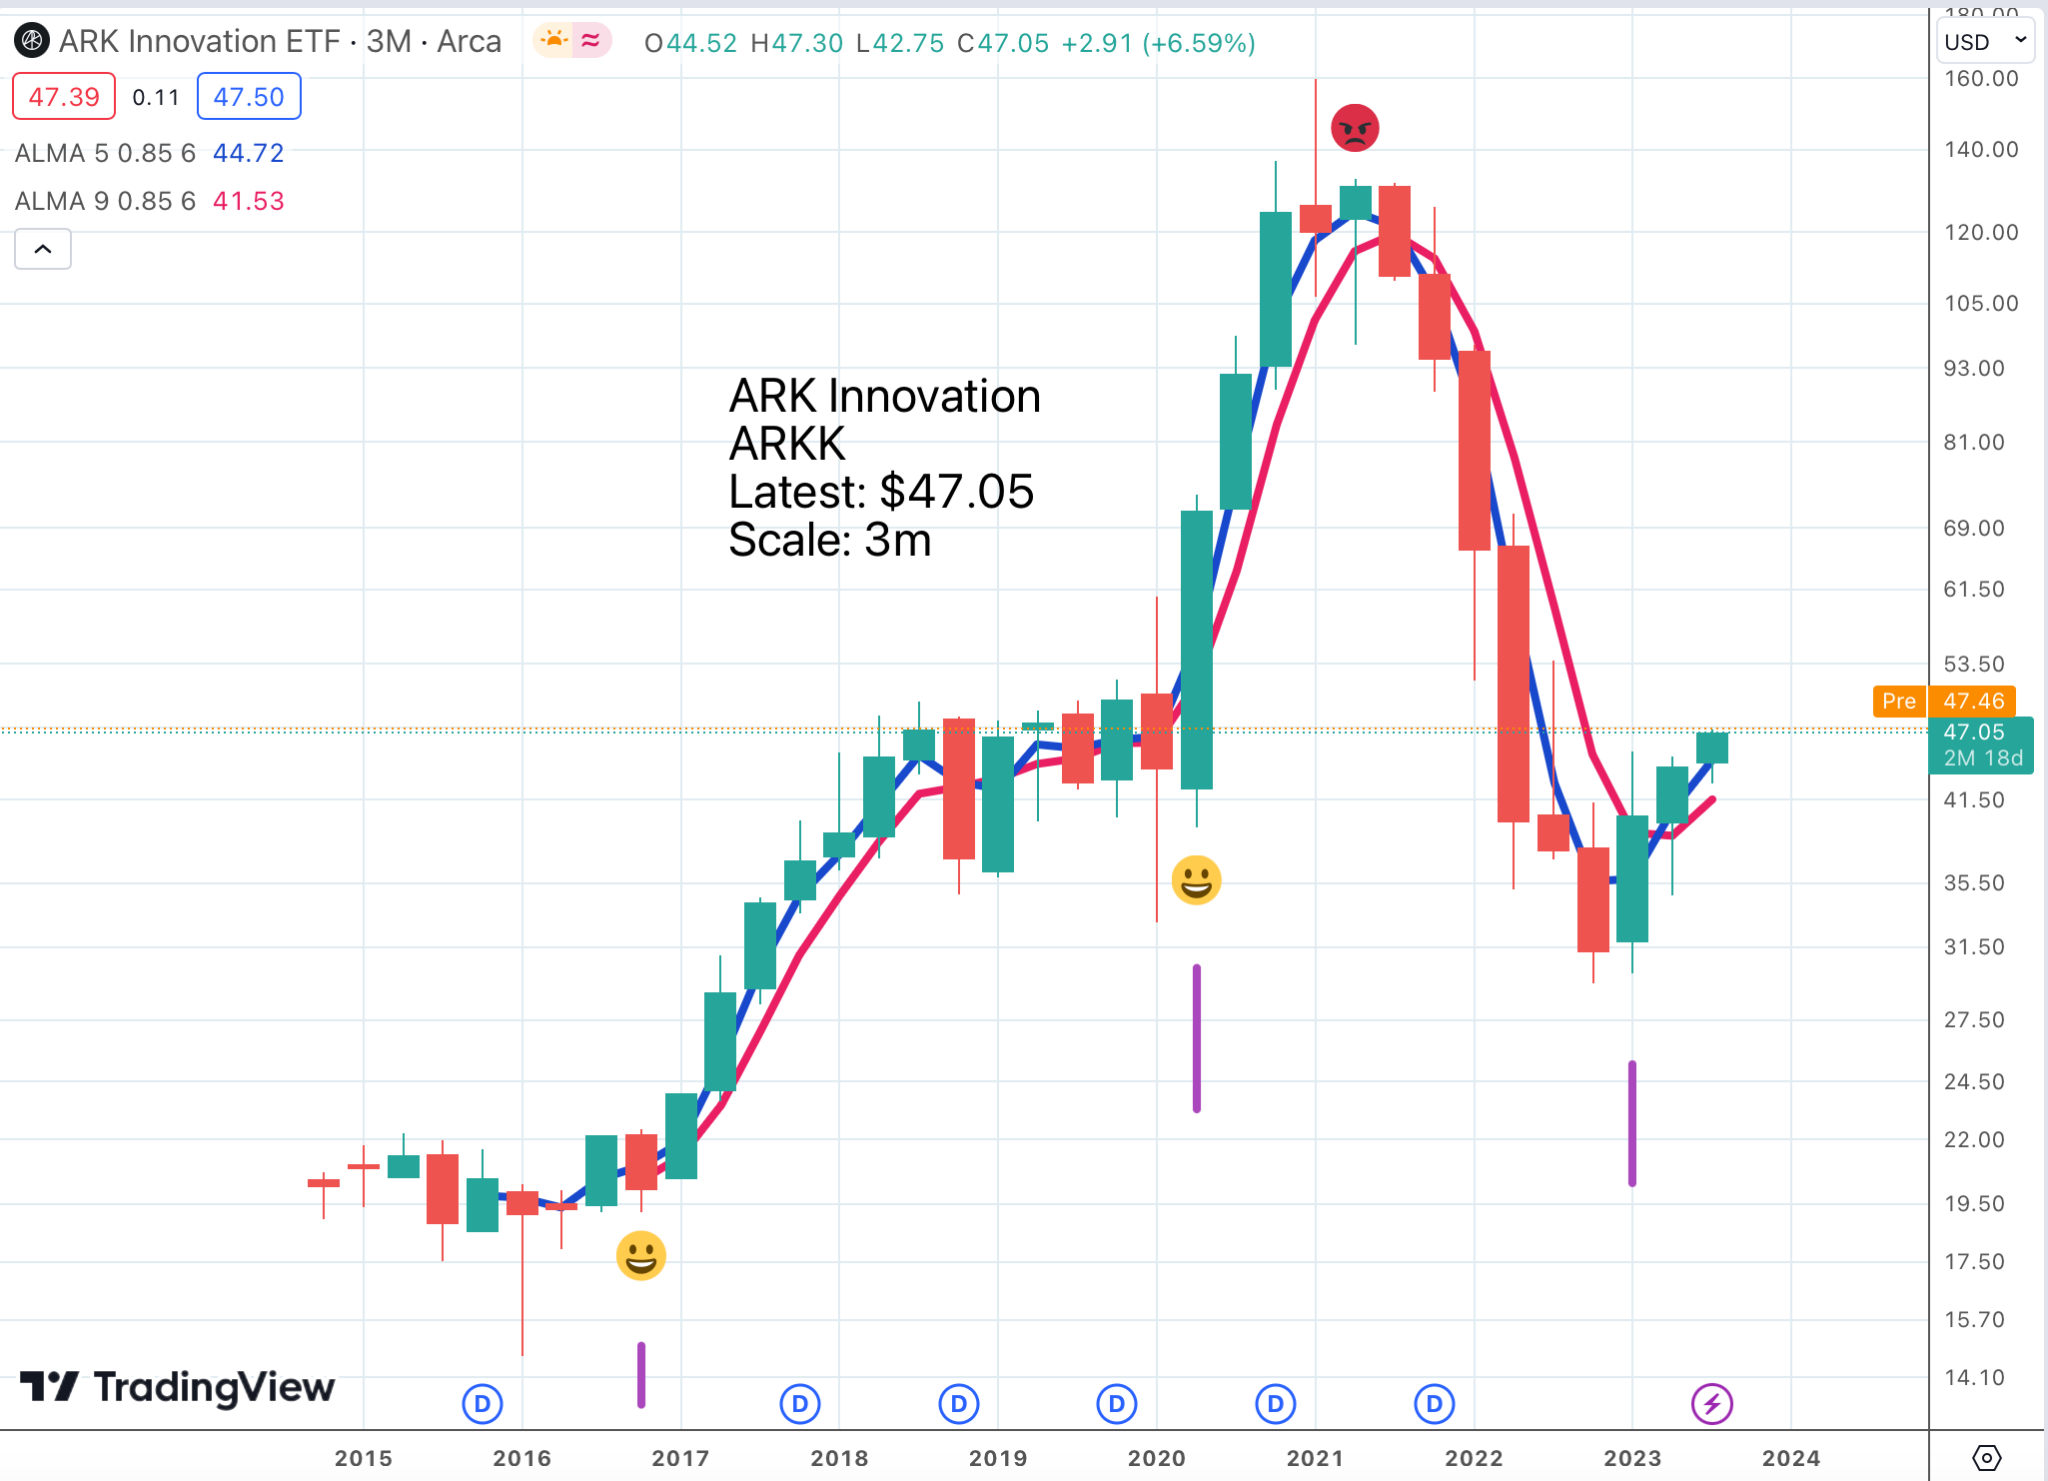
ARKK is another well behaved chart which has recently given a buy signal. It may not be possible for UK investors to buy these shares because of the ridiculous regulations but they look promising. Like OGIG this is an actively managed ETF.

An interesting feature of this list is how many of these shares, like Zoom Video, Roku, Coinbase Global, Block Inc. and Twilio have been really bombed out and have not so far recovered very much. There used to be a UK unit trust called M&G Recovery, which was an incredible performer over the years. ARKK may be shaping up to be a bit like its UK counterpart.
If we look at the chart of Zoom Video Communications, you will see what I mean.

It looks as though a base pattern is forming and there is a Coppock buy signal but with so many other shares having much stronger charts I would not bother with this one. I always want to buy the strongest, not the weakest.
There is a quote from the latest quarterly results which does suggest that ZM may do well long term, or be acquired by a deep-pocketed admirer.
We are innovating extremely quickly to bring our customers the immense benefits of generative AI and empower modern collaboration. We are trusted and loved by our amazing and diverse set of customers. And we are fortunate to be one of the most recognized brands in the world.
In Q1, we made some very tough decisions related to team size, structure and incentives that have understandably caused distraction in the short term, but at the same time exemplify our commitment to long-term growth and profitability. With a focus on the future, we have refreshed our mission and vision: “One platform delivering limitless human connection”.
Zoom Video, Q1 2024, 22 May 2023
Strategy – Build With Strongest Performers
As you can see I love shares with spectacular fundamentals and super strong charts. In performance terms Zoom Video is flatlining and expects more of the same in 2024 and the chart is struggling to get airborne; that is so not my kind of share but it is a good bet for a patient longer term investor who is prepared to wait for some action.
I would pick Fortinet over Zoom Video any day of the week and the same goes for the other individual shares featured in this alert.
Share Recommendations
Hubspot. HUBS. Buy @ $540
The Trade Desk TTD. Buy @ $82.50
Carvana CVNA. Buy @ $35.50
Fortinet. FTNT. Buy @ $78.30
ALPS O’Shares Global Internet Giants. OGIG. Buy @ $32.49
ARKK Innovation ARKK Buy @ $47
Zoom Video Communications ZM. Buy @ $69.50
Keeping An Eye On Nvidia, Broadcom, Credo Technologies And The Hardware Explosion

ChatGPT, The Black Swan Event That Changed Everything

Pope Calls For ‘Peace In Our Time’